Africa centric swell animation using Geo::ReadGRIB
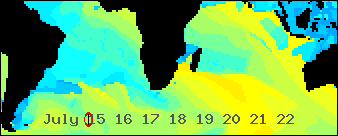 /An animated GIF abstracted from a world wide Wavewatch III GRIB dataset/
/showing all the seas were swells bound for southern Africa might be generated/
/An animated GIF abstracted from a world wide Wavewatch III GRIB dataset/
/showing all the seas were swells bound for southern Africa might be generated/
*A work in progress*
The above animated image shows the period of the primary wave for seven days starting today, Greenwich time. It's still a work in progress. I spent most of the day implementing a number of ideas that have been germinating in my head for a while. I'm feeling good about what I have so far.
*Problem 1. Put Africa in the center*
The zeroth line of longitude runs through Africa. This puts the south Atlantic and south Indian oceans, which I want to include, on opposite ends of the world map. This is a challenge for the generalized map image drawing software I'm working on. I want to feed it a */Geo::ReadGRIB/* data structure and get a map animated by time. It, naturally, wants to put lower numbered longitudes to the west of higher numbered ones. A ReadGRIB object is hash based so I need to sort my data by time and then by longitude and then latitude. The elegant solution would be to reimplement my sort so it knows that the world is round. For now, I use a cheep trick instead. I shift all longs west until they are in order again.
*Problem 2. Come up with a time display you can /SEE/ while watching the data flow*
I'm using an analog solution. Most animations from Wavewatch III data that I've seen use a digital display. One typical solution shows the date of the GRIB file and a changing "forecast hour". This is a number that changes to show the how many hours the current frame is after the "nowcast" time. It's not very easy to see what day a swell is predicted to hit your beach. You have to see a number in the corner of your eye and do some math in your head. It's much easier to interpret a pointer moving along an analog scale. It's harder to program of course.
*Make the image about 350 pixels wide*
The only Wavewatch III data file I know of that shows the Indian Ocean is the worldwide nww3 series. They have a resolution of 1.25 degrees of longitude. I want an image about 350 pixels wide and I decided I might as well show a wider view then originally planed. It's 210 degrees wide -- 168 data points. Then I exactly double the size using a resample function.
*What's left to do?*
- Cover jaggy edged landmass shadow areas with /hopefully/ smother map images.
- Create a key image that will map the colors used to data values. This will probably be a colorful ban along the top or bottom
- Tweak the data-to-color mappings to best show potentially surfable swells. This will be tricky...
[/items/Perl]
permanent link

